Climdex
Climdex offers users pre-computed data on observed climatee extremes. If you’ve ever wanted to know, “How quickly is the hottest January day warming up across Europe?” or, “Are the heaviest winter rain days changing in south-east Australia, and are they changing more than typical rainfall?” then climdex.org is the site for you.
I was brought on to improve the Climdex user experience. I initially gave the website a coat of paint, but we quickly realised that the site needed more substantial backend work in order to improve its usability, maintainability and extensibility as new datasets were introduced.
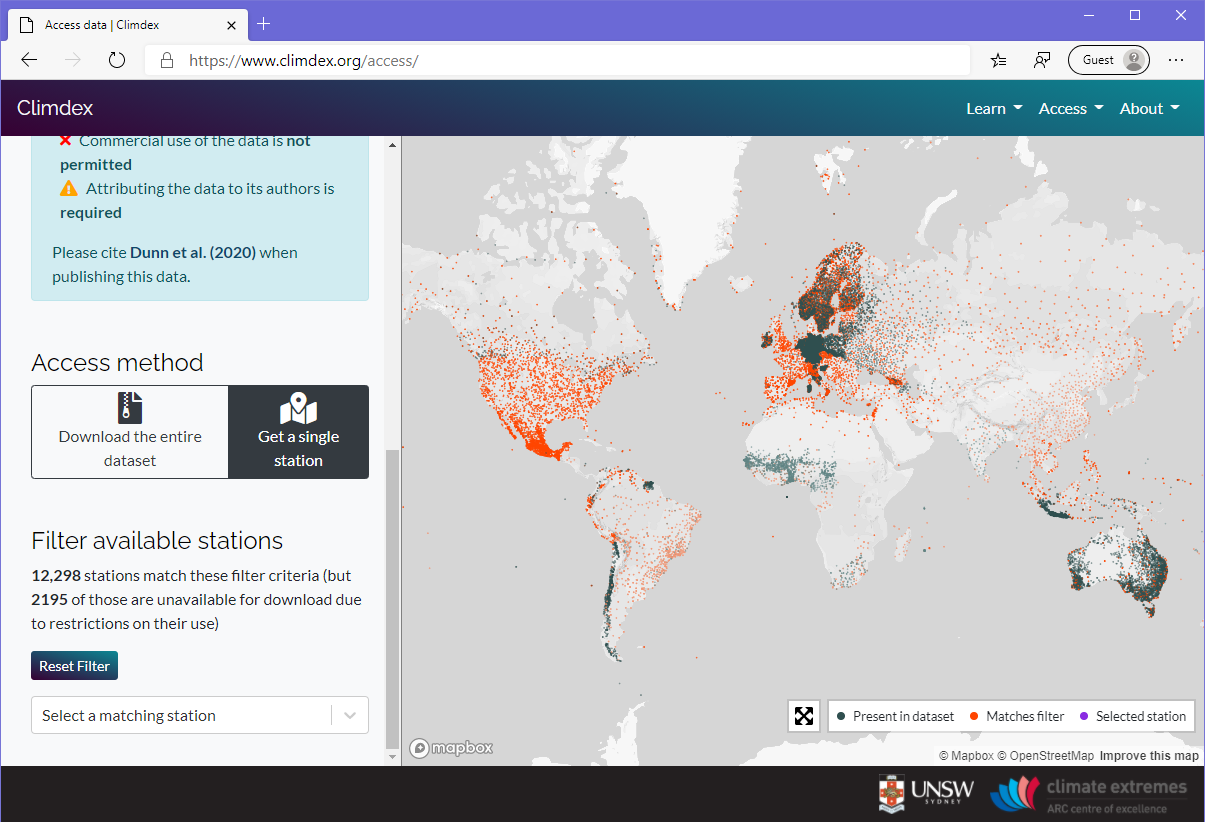
All data access on climdex.org now functions as a single-page React app that harnesses the power of DeckGL to help users filter thousands of global weather stations. This app consumes a RESTful API (built in R with the plumber package), allowing administrators to easily introduce new datasets and meet the needs of sector stakeholders.