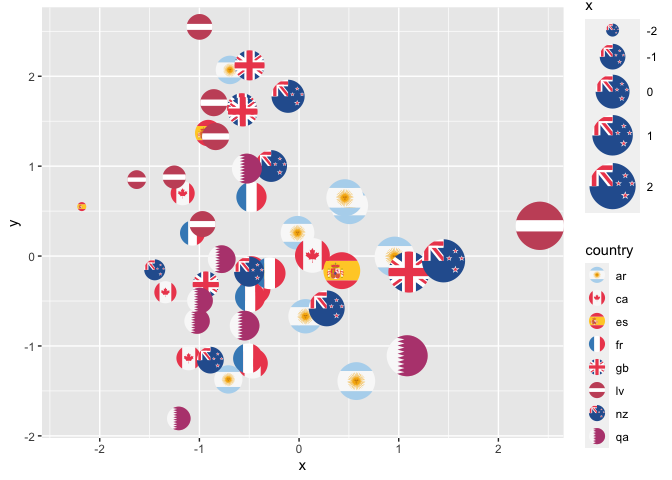
A package for plotting country flags as bubbles or balloons in ggplot.
I’ve taken over development of ggflags, an extension to ggplot2 that allows you to plot country flags as points or bubbles. The original was developed by Baptiste’s Auguié, and I’ve so far extended it to use round, vector flags from the EmojiOne v2 set (so they’ll look great at any size).
If you’re having a problem with the package or would like to contribute to its development and maintenance, feel free to open an issue or open a pull request!
{ggflags} package